SUBSTANTIVE RESEARCH
White Paper reveals state of market data pricing ahead of FCA wholesale data markets study


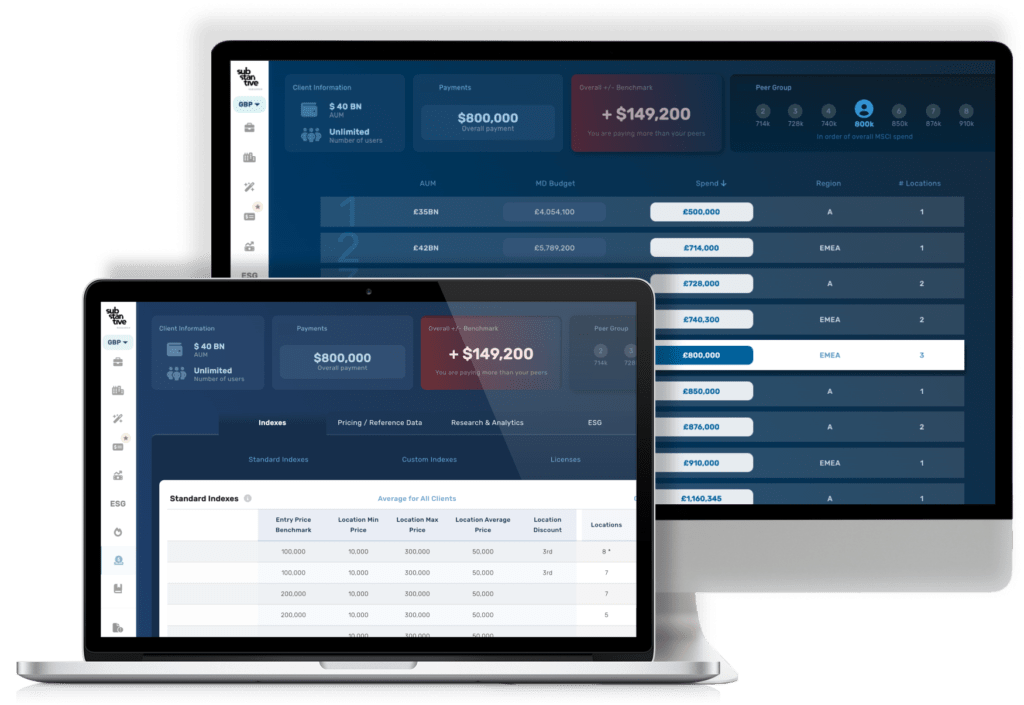
Market Data Spend Analytics
Industry first apples-to-apples market data price benchmarks for market data procurement professionals across index providers, rating agencies, pricing and reference data, research/analytics and ESG


PRICE BENCHMARKS
Price benchmarks that isolate pricing drivers by market segment, product and provider matched to specific client use cases.
Transparency across market data spend to optimize decision making and budgets.
LIKE FOR LIKE COMPARISONS
Niche Pricing Drivers
Many providers have pricing drivers specific only to them, which are applied across their entire client base.Bottom Up Approach
The benchmarks are then reconstructed from units so that they match the client’s use case with each particular provider. This takes into account: users, number of licenses, AuM, customization, etc.Apples-to-Apples Benchmarks
These factors are applied to the methodology in order to ensure apples to apples comparison that reflect the reality of the providers’ negotiation behavior. 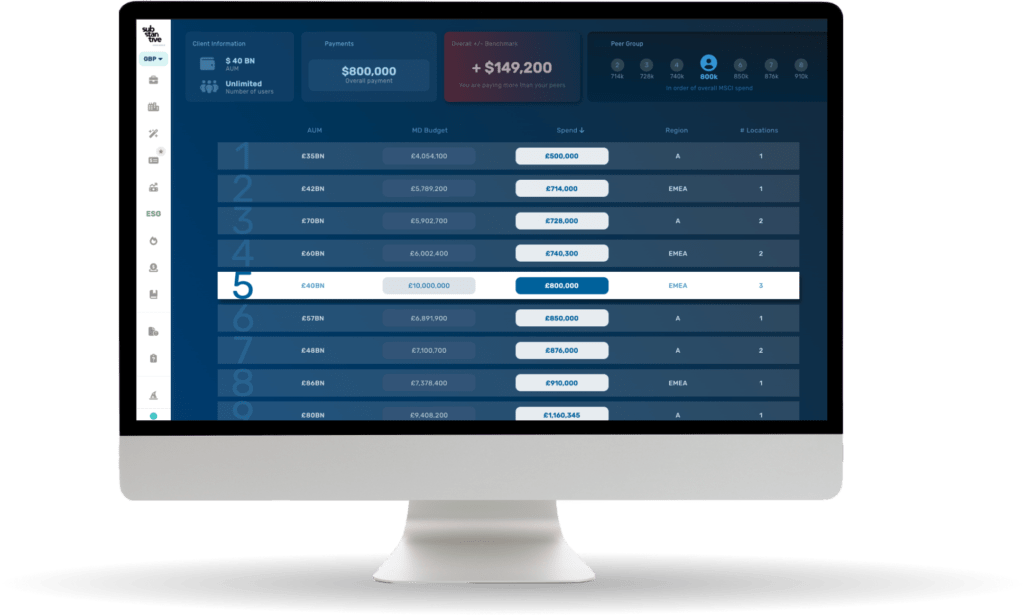
BUDGET BENCHMARKING
Identifying Efficiencies
Key internal best practice messages from the data.Market Share
Identify which providers are gaining traction, and which types of data are attracting greater investment.Price Movement
Which providers are changing business and pricing models.Trend
Growth in overall budget as well as in each specific segment.
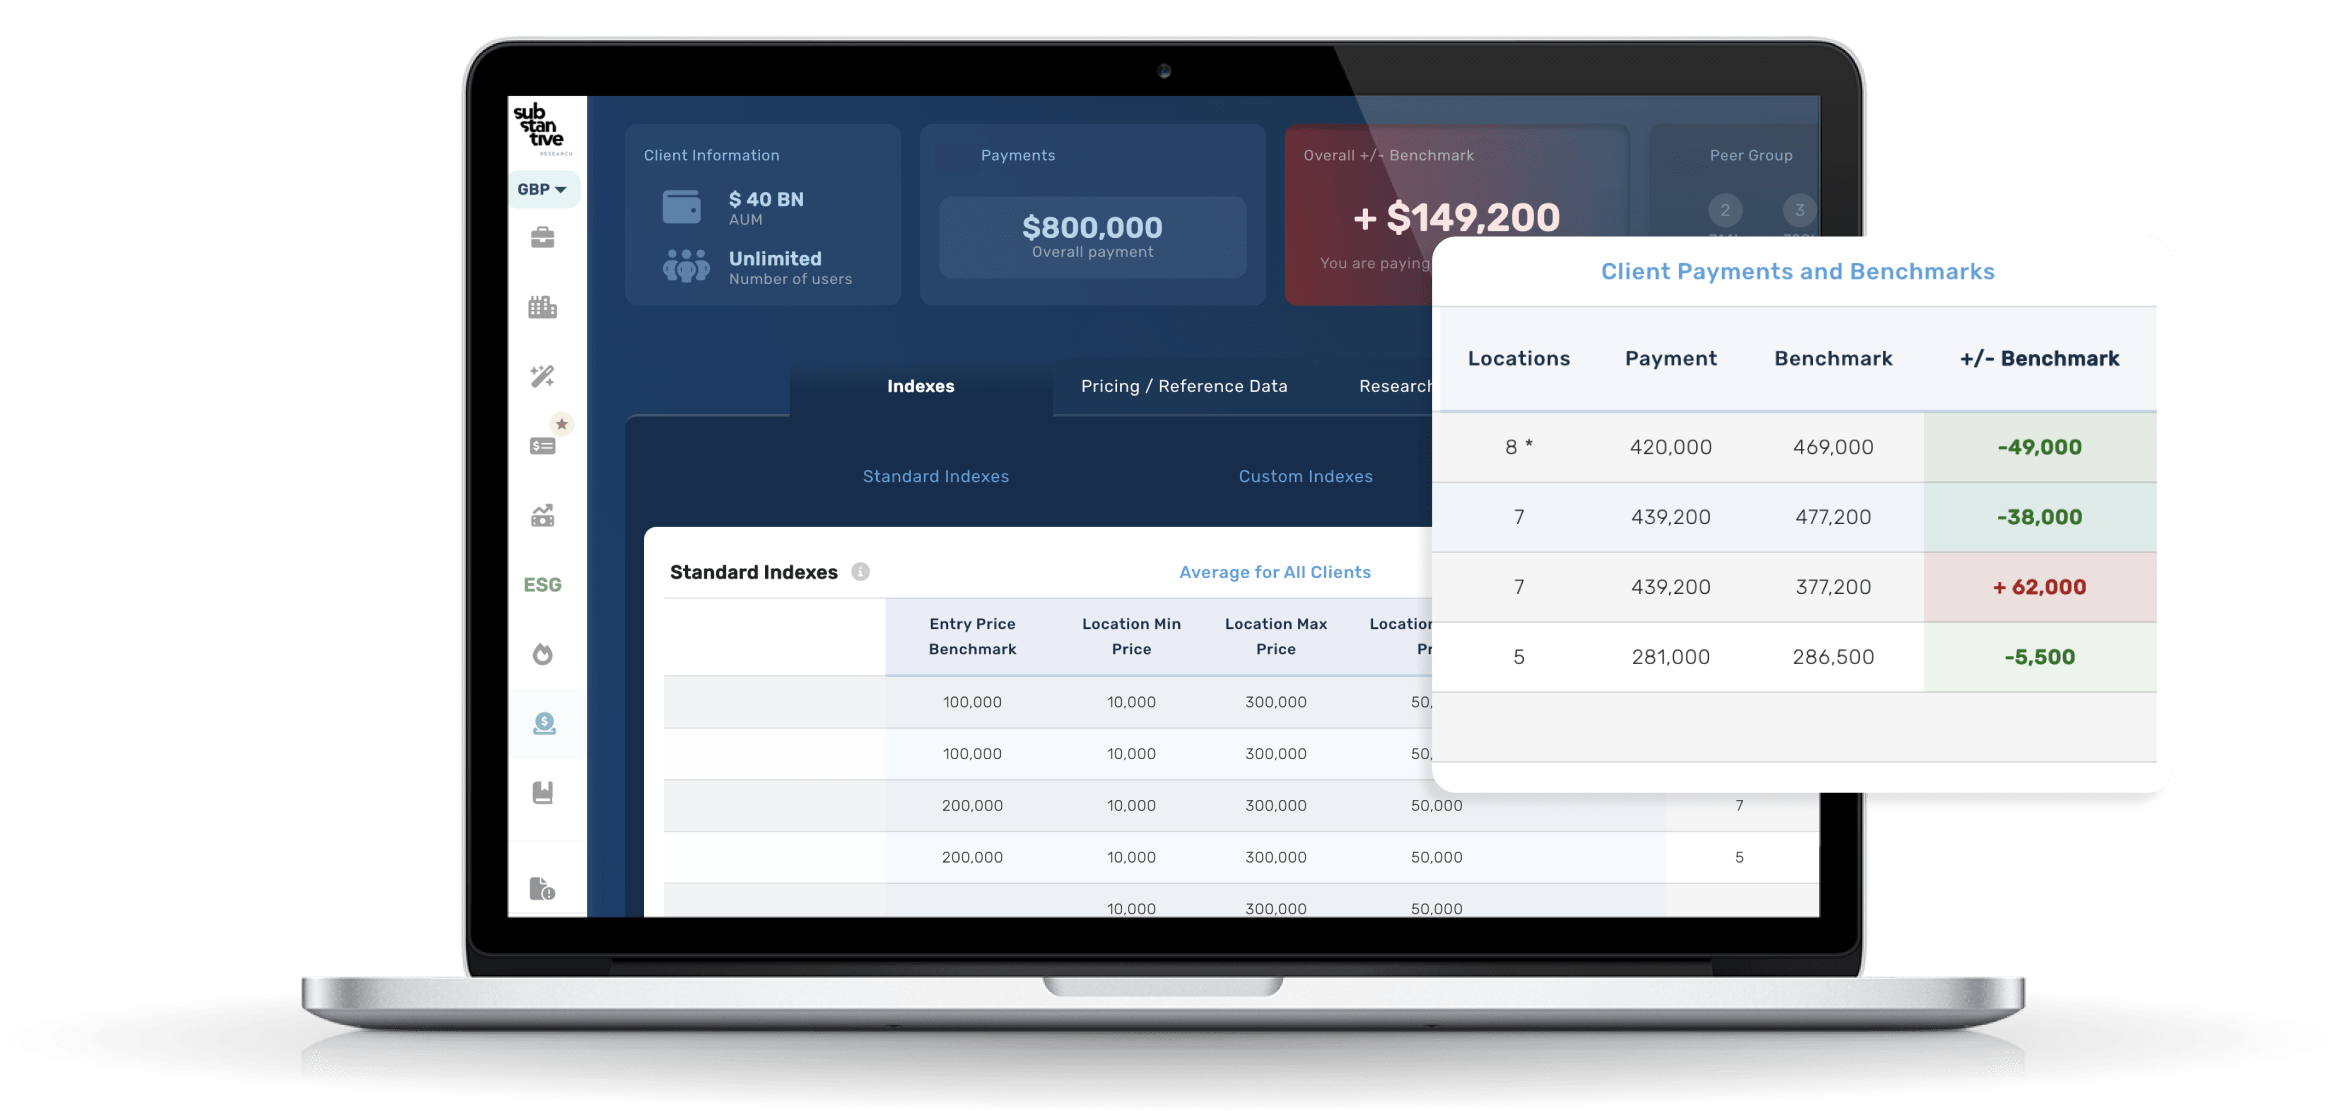
Transparency matters
Pricing is not consistent in this market: even accounting for specific “apples-to-apples” use cases, the range of inconsistencies applied to pricing post-negotiation is between 10% and 50%. Transparency matters!
Frequently asked questions
On average, clients discover that they are over the benchmark with 50% of their market data providers with an average potential saving of $360,000 per provider (in relation to the top 5 providers of customer budgets). They use Substantive to understand how their payments to market data providers per product compare vs peers for like for like services.
Key benefits include:
- Identify opportunities to save money through mitigating price increases
- Increase access/service as you identify where you are missing out
- Demonstrate efficiency to internal stakeholders
- Scenario analysis on changes of use case – what should we be paying if we change in size or data requirements?
- Gain transparency on spend vs the peer group/market.
Peer groups are dynamic, meaning we pull from 80+ comprehensive market datasets and formulate peer groups at a granular level. Broad client peer groups are still considered in the initial formation of the price benchmarks – methodologies then focus on precise pricing drivers delivering benchmarks per vendor per product. (e.g. locations may be a driving factor for some products, user bands for others, and AUM for others.)
Our dynamic benchmark work is down to the granular level – your specific use case per product per provider is what captures your uniqueness, not an arbitrary definition of “firms like you”.
Where there are few realistic alternative providers, price negotiation is always a challenge, so the focus switches to minimizing price increase and ensuring that you are optimizing your use case with each vendor. Our data shows that even in these cases, robust and knowledgeable negotiations make material differences, especially over multiple years. And with other parts of the market data budget there are alternatives and the buyers’ leverage is higher, and savings are realistic and highly achievable.
Most benchmarks are delivered within 3-4 weeks once we have received the data. Deliveries and updates then happen throughout the year, including alerts on important changes in pricing models across the market.
No, we provide the benchmarks and insights so you can leverage it in your negotiations. After each vendor meeting more questions inevitably will come up, so our account management structure allows us to deep dive into each step of negotiations with clients.
We offer a high level “try before you buy” feature available on our Market Data Product Page on our website – go check it out here!

Market Data Insights