Asset managers now able to track and benchmark analyst moves, seniority and coverage for relevant sectors
London 23 November 2020: Substantive Research, the research discovery and research spend analytics provider for the buy-side, has today launched its Analyst Mapping service, allowing asset managers to gain an aggregated view of banks’ analyst moves, their seniority and sector coverage of relevance to them. Managers can now understand which brokers are investing or disinvesting in experienced analysts covering the sectors and asset classes pertinent to their strategies and allocate their research budgets more efficiently, to ensure the quality of research is maintained.
The changes in the provision and consumption of research following MiFID II unbundling requirements coupled with the move to virtual engagements in response to COVID-19 has presented asset managers with a number of challenges. They have to ensure that their investment professionals receive the quality research they need, at an appropriate valuation. Furthermore, brokers are continuously making changes across their analyst teams as they concentrate on their comparative advantages and areas of greatest leverage.
By launching its Analyst Mapping service, Substantive Research gives buy-side firms access to centralised data to track analyst moves, providing them with crucial context for the evaluation and benchmarking of their payments to research providers. This helps managers optimise their research spend and better manage their broker relationships, whilst recognising where their providers are investing.
What’s more, firms can recognise new areas of quality and coverage inside and outside their existing broker list. This is particularly important post MIFID II, as they are no longer allowed to read research they haven’t paid for.
Mike Carrodus, CEO of Substantive Research, said: “The global research market shows no sign of convergence yet. Europe remains committed to unbundling, with asset managers paying for research from their own P&L, but considering a softening of the rules for research on SMEs and fixed income; at the same time, the US continues to pass research costs to their client base. However, it is clear that both sides are working with capped budgets, meaning they are allocating carefully and transparently.”
He added: “Our Analyst Mapping tool will enable asset managers to have an aggregate view over analyst moves across the market, evaluate where banks invest or disinvest, benchmark sector expertise gains and losses broker by broker, and ultimately decide how to allocate their research spend in relation to the areas and asset classes relevant to them.”
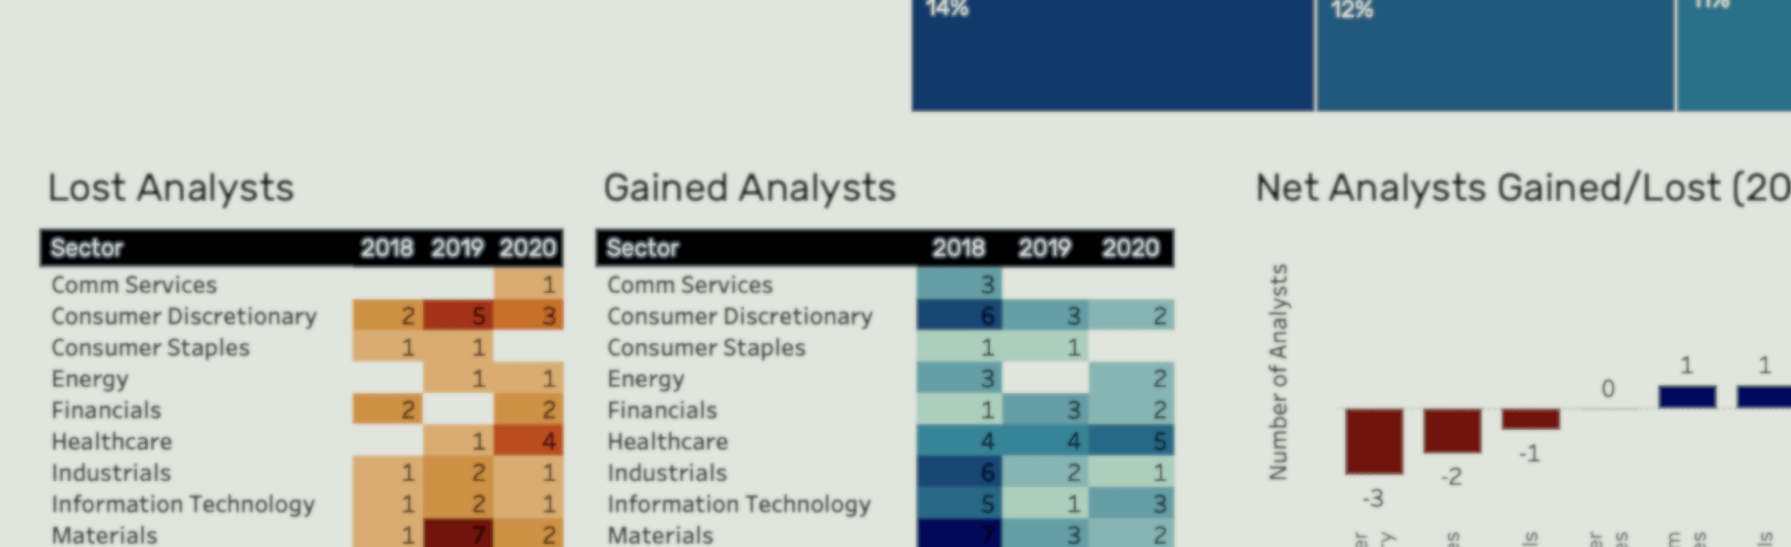
The Analyst Mapping service is delivered as a realtime Dashboard, breaking down relevant data by country, sector and individual brokers; multiple disparate data sources are cleaned, standardised and checked for gaps to ensure accuracy and enable a holistic view.
Key developments in analyst moves since MiFID II came into force include:
- In proportionate terms, since MiFID II came into effect European brokers have shrunk their analyst teams at least three times more than their US counterparts. We have seen a 12% loss of analysts in Europe vs a 4% loss in the US.
- For both Europe and the US the majority of analyst losses took place in 2018 and 2019; increases in 2020 YTD do not outweigh the previous losses.
- Of the analysts lost by US banks from 2018-2020, 61% covered US markets, equating to 172 individuals. Of the analysts gained over the same period of time, 16.3% (equivalent to 46 individuals) are in the UK. In other words, US banks have shrunk their local teams but continued to invest in their international presence, increasing the number of analysts in the UK [who also cover Europe from the UK] and Asia, to cater to customer demand for research coverage outside the US
- Of the analysts lost by European Banks from 2018-2020, 66% covered the US; this equates to 121 individuals. However, European banks increased their UK analyst teams by 8.2% over the same period of time, equivalent to 15 individuals. This means European banks have consolidated back to their core markets, providing pan-European research coverage from the UK and withdrawing from the US.
- From 2018-2020, US brokers in aggregate have grown their analyst teams covering Financials (+6%) and Real Estate (+10%), and shrunk in the other sectors, with Energy (-23%) and Industrials (-21%) being hardest hit.
- In 2020 alone, US banks have increased their analyst teams across 6 sectors, with highest gains across Financials (+18%), IT and Real Estate (with 9% each)
- In Europe, brokers have shrunk their teams across all sectors between 2018 and 2020, with Energy and Healthcare being hardest hit, with an 18% loss of analysts in each area
- In Europe, in 2020 alone, the downward trend continues with Healthcare shrinking 14%, Financials and Energy each losing 7% of their analyst teams and IT being the exception, showing a slight increase of 2%.
The Analyst Mapping dashboard has already been rolled out to 35-40 clients and will be complete to all Substantive Research clients by the end of the year. Additional areas of functionality will be added to the dashboard over time, driven by user requests for more granular insights into the research and analyst sectors.